The Power of GIS
(Geographic Information Systems)
The David Dunlap Observatory Forest in Richmond Hill, Ontario, is a unique and powerful case study for examining how natural landscapes are affected by urban development. This page presents a detailed analysis using satellite imagery and geospatial techniques to track changes in vegetation and built-up areas over time. In recent years, the Observatory lands have faced intense urban sprawl from Toronto’s expansion, visibly and measurably resulting in the loss of over half of the remaining natural environment. What’s left is a fragmented and increasingly degraded landscape that continues to face ecological pressure.
Geographic Information Systems
Kyle Edward Kuthe
🕒 Estimated reading time: 2 minutes
Geographic Information Systems (GIS) are tools used to map, analyze, and visualize spatial data. With GIS, we can layer different types of information, like elevation, soil, land use, or water features to map to understand landscapes better. Platforms like Google Maps give us base imagery like below, while more advanced software such as ArcGIS Pro or QGIS allow us to bring in detailed geospatial data, for example, shapefiles (map data layers) to perform deeper analysis. Using Python coding, we can go even further: applying more complex calculations, automating workflows, and analyzing terrain or tracking land change over time with precision.
Geomatics is the branch of science that deals with the collection, analysis, and interpretation of data relating to the Earth's surface. For more on field collection of data and geomatics, you can see the land surveying pages with experiments with collected GPS data and Python for boundary creation.

Spatial Data?
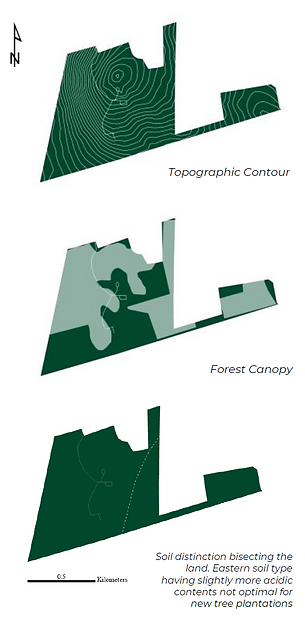
First, you can see how GIS and geospatial techniques allow us to bring in and work with a wide range of data, as shown in these three simple maps. These maps use data sourced from York Region Open Data and were prepared in ArcGIS Pro to isolate and focus specifically on the David Dunlap Observatory (DDO) lands. With this approach, we can not only visualize land features, such as topography, forest canopy, and soil types, but also perform advanced analysis and calculations to extract precise information about the DDO site itself.
Remote Sensing
Kyle Edward Kuthe
🕒 Estimated reading time: 5-6 minutes
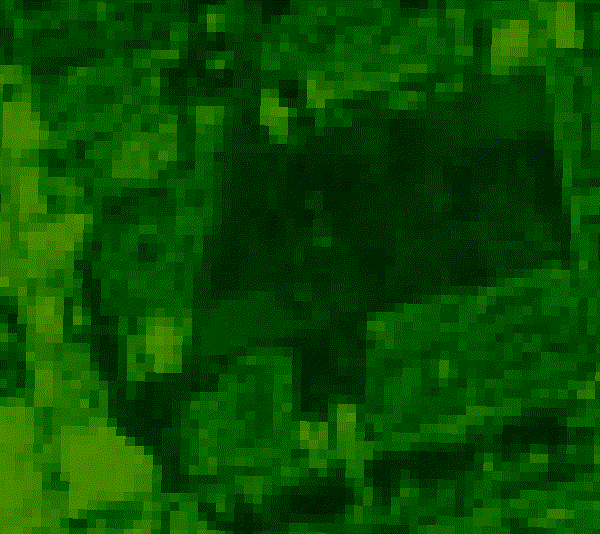
This remote sensing study, done by Kyle Kuthe, uses Landsat 8 satellite imagery and Google Earth Engine to view and analyze the transformation of the David Dunlap Observatory (DDO) lands in Richmond Hill from 2013 to 2021. Using the Normalized Difference Vegetation Index (NDVI), we monitored changes in vegetation health and coverage over time to better understand how urban development has impacted the site.
By classifying land into natural (vegetated) and built (non-vegetated) areas, the study revealed a significant loss of green space: over 74% of the natural environment in the (red) region of interest by 2019, largely due to housing development on the eastern side of the property. The analysis pinpointed 2015 as the tipping point, when built-up land overtook natural land in the region.
To further assess the ecological impact, a fragmentation and patch analysis was conducted. This examined how remaining vegetation was broken up into smaller, disconnected patches. As the number of patches increased and their size decreased, it became clear that the forest was undergoing typical fragmentation, which can disrupt habitats, reduce biodiversity, and isolate species populations.
The study also highlighted a small but measurable restoration attempt by the City of Richmond Hill between 2019 and 2021, when new trees were planted. However, this effort was not enough to reverse the broader trend of ecosystem loss.
Through satellite-based time-lapse maps, vegetation loss graphs, and landscape classification, this project helps illustrate the real ecological cost of unchecked urban sprawl and supports the need for stronger conservation planning at the DDO Park.

True Colour
NDVI
Binary


Area of most change.


Aerial Photography
Aerial imagery refers to photographs of the Earth taken from aircraft (typically planes or drones), and is another type of remote sensing technique. Long before satellites, these images were a primary tool for documenting landscapes from above. Because aerial photos have been collected for decades (often by government or municipal sources), they allow us to visually go back in time with high resolution. In this quick project, we use historical aerial photos from the City of Toronto Archieves to trace how the DDO lands have changed over time, revealing the steady loss of forest cover and the spread of urban development.

Kyle Edward Kuthe
🕒 Estimated reading time: 4-5 minutes
Gallery 1956 - 1975


